class: middle, title-slide # Inference and Significance ## Null Hypothesis Significance Tests ### Dennis A. V. Dittrich ### 2021 --- layout: true <div class="my-footer"> <span><img src="img/tcb-logo.png" height="40px"></span> </div> --- ## Hypothesis Tests .row[.col-7[ **Hypothesis test** A process that uses sample statistics to test a claim about the value of a population parameter. .tip[ For example: Consider a manufacturer that advertises its new hybrid car has a mean gas mileage of 50 miles per gallon. If you suspect that the mean mileage is not 50 miles per gallon, how could you show that the advertisement is false? ] ] .col-5[ A **parameter** for a hypothesis test is the "true" value of interest. We typically estimate the parameter using a **sample statistic** as a **point estimate**. `\(m~\)`: true mileage per gallon `\(\hat{m}~\)`: mean mileage per gallon in the sample ] ] --- ## Statistical hypothesis .row[.col-6[ - A statement about a population parameter. - Carefully state a pair of hypotheses - one that represents the claim - the other, its complement - When one of these hypotheses is false, the other must be true. - Either hypothesis—the null hypothesis or the alternative hypothesis—may represent the original claim. ] .col-6[ **A null hypothesis `\(H_0\)`** is a statistical hypothesis that contains a statement of equality, such as `\(\leq\)` , `\(=\)`, or `\(\geq\)`. **The alternative hypothesis `\(H_a\)`** is the complement of the null hypothesis. It is a statement that must be true if `\(H_0\)` is false and it contains a statement of strict inequality, such as `\(>\)`, `\(\neq\)`, or `\(<\)`. The symbol `\(H_0\)` is read as "H sub-zero" or "H naught" and `\(H_a\)` is read as "H sub-a." ]] --- ## Stating a Hypothesis .row[.col-7[ To write the null and alternative hypotheses, translate the claim made about the population parameter from a verbal statement to a mathematical statement. Then, write its complement. `\(H_0: \mu \leq k\)` and `\(H_a: \mu > k\)` `\(H_0: \mu \geq k\)` and `\(H_a: \mu < k\)` `\(H_0: \mu = k\)` and `\(H_a: \mu \neq k\)` Regardless of which pair of hypotheses you use, you always assume `\(\mu = k\)` and examine the sampling distribution on the basis of this assumption. ]] --- ## Stating the Null and Alternative Hypotheses .row[.col-7[ .tip[ #### Example: Write each claim as a mathematical sentence. State the null and alternative hypotheses and identify which represents the claim. A school publicizes that the proportion of its students who are involved in at least one extracurricular activity is 61%. #### Solution: `\(H_0: p = 0.61\)` — Equality condition (Claim) `\(H_a: p \neq 0.61\)` — Complement of `\(H_0\)` ]]] --- ## Stating the Null and Alternative Hypotheses .row[.col-7[ .tip[ #### Example: Write each claim as a mathematical sentence. State the null and alternative hypotheses and identify which represents the claim. A car dealership announces that the mean time for an oil change is less than 15 minutes. #### Solution: `\(H_0: \mu \geq 15\)` minutes — Complement of `\(H_a\)` `\(H_a: \mu < 15\)` minutes — Inequality condition (Claim) ]]] --- ## Stating the Null and Alternative Hypotheses .row[.col-7[ .tip[ #### Example: Write each claim as a mathematical sentence. State the null and alternative hypotheses and identify which represents the claim. A company advertises that the mean life of its furnaces is more than 18 years #### Solution: `\(H_0: \mu \leq 18\)` years — Complement of `\(H_a\)` `\(H_a: \mu > 18\)` years — Inequality condition (Claim) ]]] --- ## Hypothesis tests and decisions .row[ .col-5[  ] .col-7[ No matter which hypothesis represents the claim, always begin the hypothesis test assuming that the equality condition in the null hypothesis is true. So, when you perform a hypothesis test, one of two decisions will be made: 1. reject the null hypothesis 2. fail to reject the null hypothesis Because your decision is based on a sample, there is the possibility of making the wrong decision. ]] --- ## Hypothesis testing as a court trial .row[.col-7[ - **Null hypothesis**, `\(H_0\)`: Defendant is innocent - **Alternative hypothesis**, `\(H_a\)`: Defendant is guilty - **Present the evidence:** Collect data - **Judge the evidence:** "Could these data plausibly have happened by chance if the null hypothesis were true?" * Yes: Fail to reject `\(H_0\)` * No: Reject `\(H_0\)` .question[ What errors can you make with your decision? ] ]] --- ||Researcher’s Dilemma |Jury’s Dilemma| |---|---|---| |Possible states of world | Effect exists, or it doesn’t. | Accused is guilty, or not. | |Initial presumption| `\(H_0\)` true: No effect. | Not guilty. | |Basis for deciding | Small p value. | Evidence, beyond reasonable doubt.| |Decision possibilities | Reject `\(H_0\)`, there is an effect or don’t reject `\(H_0\)`, and initial presumption stands.| Guilty or not guilty, and initial presumption stands.| |Correct outcomes| Reject `\(H_0\)` when effect exists. Don’t reject `\(H_0\)` when no effect. | Guilty person jailed. Innocent person walks free. | |More serious error| False positive. Reject `\(H_0\)` when there’s really no effect. | False conviction. Innocent person jailed. | |Less serious error| Miss. Don’t reject `\(H_0\)` when there is an effect. |Miss a conviction. Guilty person walks free.| --- ## Possible Outcomes and Types of Errors .row[.col-7[ A **type I** error occurs if the null hypothesis is rejected when it is true. A **type II** error occurs if the null hypothesis is not rejected when it is false. ]] | | `\(H_0\)` is true | `\(H_0\)` is false| |---|-:|-:| |Do not reject `\(H_0\)` | Correct Decision | **Type II Error** | |Reject `\(H_0\)` | **Type I Error** | Correct Decision | --- ## Identifying Type I and Type II Errors .row[.col-7[ .tip[ #### Example The USDA limit for salmonella contamination for ground beef is 7.5%. A meat inspector reports that the ground beef produced by a company exceeds the USDA limit. You perform a hypothesis test to determine whether the meat inspector’s claim is true. When will a type I or type II error occur? Which error is more serious? ]]] --- ## Identifying Type I and Type II Errors .row[.col-7[ .tip[ Let `\(p\)` represent the proportion of ground beef that is contaminated. #### Hypotheses `\(H_0: p \leq 0.075\)` `\(H_a: p > 0.075\)` (Claim)  ]] .col-5[ A **type I error** is rejecting `\(H_0\)` when it is true. The actual proportion of contaminated ground beef is less than or equal to 0.075, but you reject `\(H_0.\)` A **type II error** is failing to reject `\(H_0\)` when it is false. The actual proportion of contaminated ground beef is greater than 0.075, but you do not reject `\(H_0.\)` ]] --- ## Identifying Type I and Type II Errors .row[.col-7[ .tip[ #### Solution With a type I error, you might create a health scare and hurt the sales of ground beef producers who were actually meeting the USDA limits. With a type II error, you could be allowing ground beef that exceeded the USDA contamination limit to be sold to consumers. A type II error is more serious because it could result in sickness or even death. ]]] --- ## Errors have real-world consequences .row[.col-7[ .question[ The nurses have petitioned the CEO of a hospital to allow them to work 12-hour shifts. He wants to please them but is afraid that the frequency of errors may increase as a result of the longer shifts. He decides to conduct a study and to test the null hypothesis that there is no increase in error rate as a result of working longer shifts against the alternative that the frequency of errors increases by at least 30%. Describe the losses associated with Type I and Type II errors. ]]] --- ## Level of Significance .row[.col-7[ .question[ Your statistics professor comes to class with a big urn that he claims contains 9999 blue marbles and 1 red marble. You draw out one marble at random and finds that it is red. Would you be willing to tell your professor that you think she is wrong about the distribution of colors? Why or why not? What are you assuming in making your decision? What if instead, he claims there are nine blue marbles and 1 red one (and you draw out a red marble)? ]]] --- ## Level of Significance .row[.col-7[ Your maximum allowable probability of making a **type I error**. - Denoted by `\(\alpha\)`, the lowercase Greek letter alpha. - A result is statistically significant if it would rarely occur by chance. - By setting the level of significance at a small value, you are saying that you want the probability of rejecting a true null hypothesis to be small. - Commonly used levels of significance: - `\(\alpha= 0.10\)` - `\(\alpha= 0.05\)` - `\(\alpha= 0.01\)` ] .col-5[ The probability of a type II error is denoted by `\(\beta\)`, the lowercase Greek letter beta. `\(1-\beta\)` is called the **power** of a test. ]] --- ## Statistical Tests .row[.col-6[ After stating the null and alternative hypotheses and specifying the level of significance, a random smaple is taken from the population and sample statistics are calculated. The statistic that is compared with the parameter in the null hypothesis is called the **test statistic**. ] .col-6[ **P-value** (or probability value) The probability, if the null hypothesis is true, of obtaining a test statistic with a value as extreme or more extreme than the one determined from the sample data. The smaller the p-value, the more unlikely are test results, IF the null hypothesis is true. ]] --- ## Nature of the Test .row[.col-7[ Three types of hypothesis tests - left-tailed test - right-tailed test - two-tailed test The type of test depends on the region of the sampling distribution that favors a rejection of `\(H_0\)`. This region is indicated by the alternative hypothesis. ]] --- ## Left-tailed Test .row[.col-7[ The alternative hypothesis, `\(H_a\)`, contains the less-than inequality symbol ( `\(<\)` ). ]]  --- ## Right-tailed Test .row[.col-7[ The alternative hypothesis, `\(H_a\)`, contains the greater-than inequality symbol ( `\(>\)` ). ]] 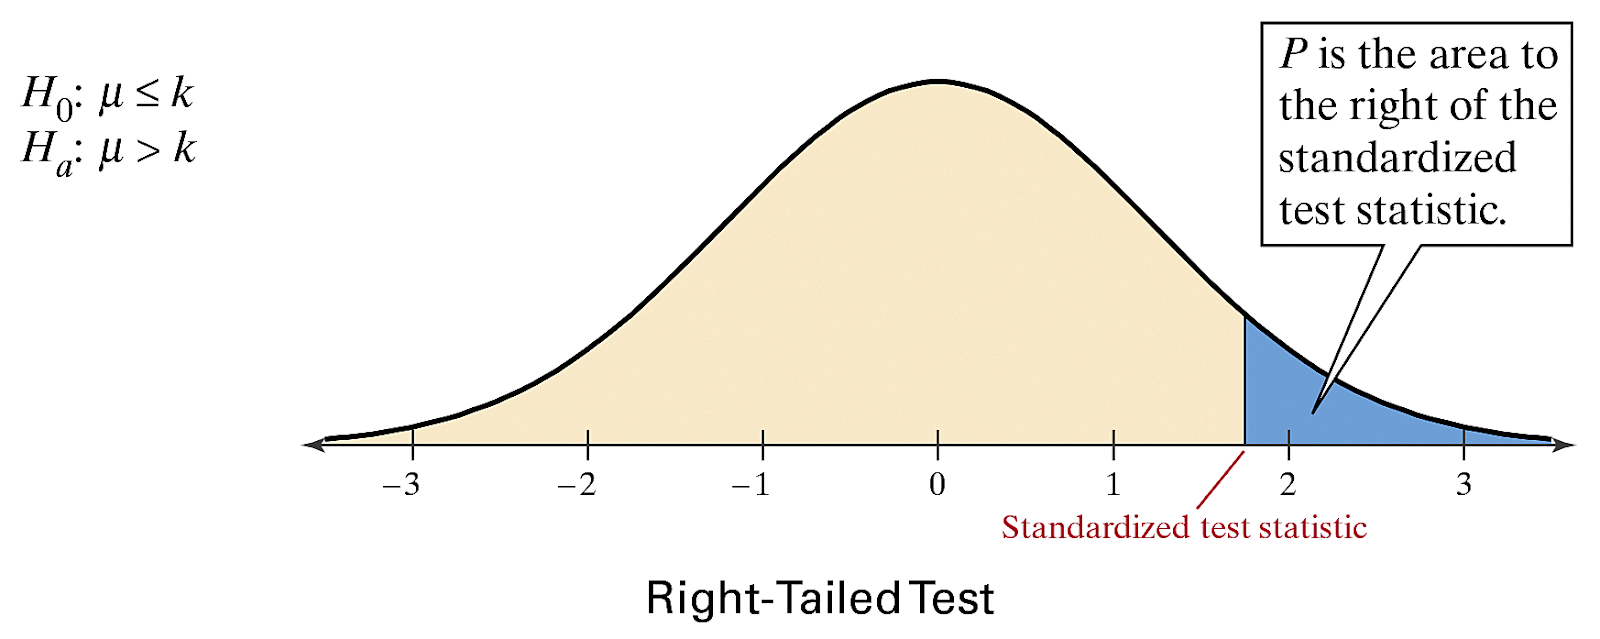 --- ## Two-tailed Test .row[.col-7[ The alternative hypothesis, `\(H_a\)`, contains the not-equal-to symbol ( `\(\neq\)` ). Each tail has an area of `\(\frac{1}{2}P\)`. ]]  --- ## Identifying The Nature of a Test .row[.col-7[ .tip[ #### Example For each claim, state `\(H_0\)` and `\(H_a\)` in words and in symbols. Then determine whether the hypothesis test is a left-tailed, right-tailed, or two-tailed test. Sketch a normal sampling distribution and shade the area for the P-value. A school publicizes that the proportion of its students who are involved in at least one extracurricular activity is 61%. ]]] --- ## Identifying The Nature of a Test .tip[ .row[.col-7[ #### Solution **In Symbols** `\(H_0: p = 0.61\)` vs `\(H_a: p \neq 0.61\)` **In Words** The proportion of students who are involved in at least one extracurricular activity is 61%. vs The proportion of students who are involved in at least one extracurricular activity is not 61%. Because `\(H_a\)` contains the `\(\neq\)` symbol, the test is a two-tailed hypothesis test. ] .col-5[  ]]] --- ## Identifying The Nature of a Test .row[.col-7[.tip[ #### Example For each claim, state `\(H_0\)` and `\(H_a\)` in words and in symbols. Then determine whether the hypothesis test is a left-tailed, right-tailed, or two-tailed test. Sketch a normal sampling distribution and shade the area for the P-value. A car dealership announces that the mean time for an oil change is less than 15 minutes. ]]] --- ## Identifying The Nature of a Test .tip[.row[ .col-6[ #### Solution **In Symbols** `\(H_0: \mu \geq 15\)` minutes vs `\(H_a: \mu < 15\)` minutes **In Words** The mean time for an oil change is greater than or equal to 15 minutes. vs The mean time for an oil change is less than 15 minutes. Because `\(H_a\)` contains the `\(<\)` symbol, the test is a left-tailed hypothesis test. ] .col-6[  ]]] --- ## Identifying The Nature of a Test .row[.col-7[.tip[ #### Example For each claim, state `\(H_0\)` and `\(H_a\)` in words and in symbols. Then determine whether the hypothesis test is a left-tailed, right-tailed, or two-tailed test. Sketch a normal sampling distribution and shade the area for the P-value. A company advertises that the m ean life of its furnaces is more than 18 years. ]]] --- ## Identifying The Nature of a Test .tip[ .row[.col-7[ #### Solution **In Symbols** `\(H_0: \mu \leq 18\)` years vs `\(H_a: \mu > 18\)` years **In Words** The mean life of the furnaces is less than or equal to 18 years. vs The mean life of the furnaces is more than 18 years. Because $H_a contains the `\(>\)` symbol, the test is a right-tailed hypothesis test. ] .col-5[  ]]] --- ## Making a Decision .row[.col-7[ .pink[Decision Rule Based on p-value] Compare the p-value with `\(\alpha\)`. 1. If `\(p \leq \alpha\)`, then reject `\(H_0\)`. 2. If `\(p > \alpha\)`, then fail to reject `\(H_0\)`. | | Claim is `\(H_0\)` | Claim is `\(H_a\)` | |---|-:|-:| |Reject `\(H_0\)` | There is enough evidence to reject the claim | There is not enough evidence to reject the claim | |Fail to reject `\(H_0\)` | There is enough evidence to support the claim | There is not enough evidence to support the claim | ] .col-5[ **Null Hypothesis Significance Testing** compares p with the significance level `\(\alpha\)`. If p is less than that significance level, we **reject the null hypothesis** and declare the effect to be **statistically significant**. A lower significance level (.01 rather than .05) requires a smaller p value, which provides stronger evidence against the null hypothesis. ] ] --- ## Interpreting a Decision .tip[ .row[.col-6[ #### Example You perform a hypothesis test for the following claim. How should you interpret your decision if you reject `\(H_0\)`? If you fail to reject `\(H_0\)`? `\(H_0\)` (Claim): A school publicizes that the proportion of its students who are involved in at least one extracurricular activity is 61%. ] .col-6[ #### Solution The claim is represented by `\(H_0\)`. If you reject `\(H_ 0\)` you should conclude “there is enough evidence to reject the school’s claim that the proportion of students who are involved in at least one extracurricular activity is 61%.” If you fail to reject `\(H_0\)` you should conclude “there is not enough evidence to reject the school’s claim that the proportion of students who are involved in at least one extracurricular activity is 61%.” ]]] --- ## Interpreting a Decision .tip[.row[.col-6[ #### Example You perform a hypothesis test for the following claim. How should you interpret your decision if you reject `\(H_0\)`? If you fail to reject `\(H_0\)`? `\(H_a\)` (Claim): A car dealership announces that the mean time for an oil change is less than 15 minutes. ] .col-6[ #### Solution The claim is represented by `\(H_a\)`. `\(H_0\)` is “the mean time for an oil change is greater than or equal to 15 minutes.” If you reject `\(H_0\)` you should conclude “there is enough evidence to support the dealership’s claim that the mean time for an oil change is less than 15 minutes.” If you fail to reject `\(H_0\)` you should conclude “there is not enough evidence to support the dealership’s claim that the mean time for an oil change is less than 15 minutes.” ]]] --- ## Steps for Hypothesis Testing .row[.col-6[ 1. State the claim mathematically and verbally. Identify the null and alternative hypotheses. `\(H_0: ?\)` vs `\(H_a: ?\)` 2. Specify the level of significance. `\(\alpha = ?\)` 3. Determine the (standardized) sampling distribution and draw its graph.  ] .col-6[ <ol start=4><li>Calculate the test statistic (and its standardized value). Add it to your sketch. </li> <li>Find the p-value.</li> <li>Use the decision rule to accept or reject your hypothesis.</li> <li>Write a statement to interpret the decision in the context of the original claim.</li> <ol/> ]] --- ## Strategies for Hypothesis Testing .row[.col-7[ The strategy that you will use in hypothesis testing should depend on whether you are trying to support or reject a claim. You cannot use a hypothesis test to support your claim when your claim is the null hypothesis. As a researcher, to perform a hypothesis test where the possible outcome will support a claim, word the claim so it is the alternative hypothesis. To perform a hypothesis test where the possible outcome will reject a claim, word it so the claim is the null hypothesis. ]] --- ## Writing the Hypotheses .row[.tip.col-7[ #### Example A medical research team is investigating the benefits of a new surgical treatment. One of the claims is that the mean recovery time for patients after the new treatment is less than 96 hours. How would you write the null and alternative hypotheses when you are on the research team and want to support the claim? How should you interpret a decision that rejects the null hypothesis? ]] --- ## Writing the Hypotheses .row[.tip.col-7[ #### Solution To answer the question, first think about the context of the claim. Because you want to support this claim, make the alternative hypothesis state that the mean recovery time for patients is less than 96 hours. So, `\(H_a: \mu < 96\)` hours. Its complement, `\(H_0: μ \geq 96\)` hours, would be the null hypothesis. If you reject `\(H_0\)` then you will support the claim that the mean recovery time is less than 96 hours. `\(H_0:\mu \geq 96\)` vs `\(H_a:\mu < 96\)` (Claim) ]] --- ## Writing the Hypotheses .row[.tip.col-7[ #### Example A medical research team is investigating the benefits of a new surgical treatment. One of the claims is that the mean recovery time for patients after the new treatment is less than 96 hours. How would you write the null and alternative hypotheses when you are on an opposing team and want to reject the claim? How should you interpret a decision that rejects the null hypothesis? ]] --- ## Writing the Hypotheses .row[.tip.col-7[ #### Solution First think about the context of the claim. As an opposing researcher, you do not want the recovery time to be less than 96 hours. Because you want to reject this claim, make it the null hypothesis. So, `\(H_0: \mu \leq 96\)` hours. Its complement, `\(H_a: \mu > 96\)` hours, would be the alternative hypothesis. If you reject `\(H_0\)` then you will reject the claim that the mean recovery time is less than or equal to 96 hours. `\(H_0: \mu \leq 96\)` (Claim) vs `\(H_a: \mu > 96\)` ]] --- ## Good practice .row[.col-6[ + Beware dichotomous conclusions, which may give a false sense of certainty. **Prefer estimation thinking**. Express research aims as “how much” or “to what extent” questions. + To **avoid ambiguity**, add “statistical” in front of “significant” whenever that’s the intended meaning. For other meanings, replace “significant” by “important”, “notable”, “large”, or some other suitable word. ] .col-6[ + A large p value provides no evidence that the null hypothesis is true. **Beware accepting the null hypothesis**. Beware the slippery slope of non-significance. + Always remember: The p value is **not** the probability that our results are due to chance, i.e. the probability that `\(H_0\)` is true. Instead, the p-value is the probability of observing the test statistics (obtaining our sample data) or a more extreme test statistics given `\(H_0\)` is true. ]] --- ## NHST and Estimation ### P-value and the onfidence Interval .row[.col-6[ If the null hypothesis value lies outside the C% confidence interval, the p value is less than `\(1-C\)`, so p is less than the significance level `\(\alpha= 1-C\)` and we reject the null hypothesis. If the null hypothesis lies inside the C% confidence interval, the p value is greater than `\(1-C = \alpha\)`, so we don’t reject. The further our sample result falls from the null hypothesis value, the smaller the p value and the stronger the evidence against the null hypothesis. ] .col-6[ <img src="08.inference_files/figure-html/unnamed-chunk-2-1.png" width="100%" style="display: block; margin: auto;" /> ] ]